Archive for the 'charting' Category

5 Tips for Styling with Pentaho Report Designer

I’m a big fan of Google Analytics, I use it for all my personal websites to see what type of traffic I get.  One of my colleagues who is also impressed with their reports wanted to know if you could make a Pentaho Report look as good as Google’s output.  I quickly threw together the following report, to show that you can design just about anything in Pentaho Report Designer!
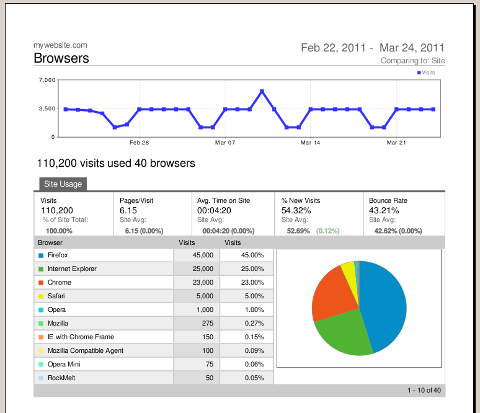
Check out the PDF and HTML rendering of the report.  Feel free to use the PRPT as a template for your own reports.

Here are my top 5 recommendations for folks when designing reports like this:

  1. Don’t be tempted to use the lines and rectangles.  Instead, use padding and borders of bands and elements.
  2. Inline Subreports allow you to pretty much layout anything, use them!
  3. The message-field report element is very powerful, you can specify number and date formats as part of the message: $(field, date, MMM yyyy).
  4. Make sure to test rendering in the output formats that you care about.  HTML renders as a set of tables, so you can’t have overlapping objects in your report.
  5. Take advantage of the “Paste Formatting” option, this allows you to copy colors, font sizes, etc, and will save you a lot of time.

And of course don’t forget to get a copy of Pentaho Reporting 3.5 for Java Developers :-).  The book covers many topics, you can learn a lot about formula functions, chart options, shortcut keys, and much more.

Pentaho at Google I/O

I just got back from a great trip to San Francisco, where Mike D. and I represented Pentaho at the Google I/O Sandbox.  In addition to getting my free Android phone and playing some serious air hockey, I also got the chance to meet a lot of great people.  Mike and I got to meet a many of the folks on the Google Web Toolkit team, and I know they were very happy that they can now talk about the Wave project and their participation in it.  I can’t tell you how excited I am about Wave, and also how excited I am for the future of GWT and HTML 5.0.

There are so many great things happening within GWT at the moment, that Mike and I will probably get GWT trunk building so we can start playing with it.  This includes dynamic script loading, better hosted mode support, along with fantastic reports to help optimize your GWT compile sizes.

Another surreal moment for me at the conference was when Steven Canvin of Lego showed off the WiigoBot, one of my many Lego robots, on stage during the second key note right before Wave came on.  I’m a big fan of lego, so much so that I created the first ever Lego bar chart and presented it during the Sandbox event:

You can find instructions to build your own out on the Pentaho’s Wiki, including having it work with the Pentaho BI Platform!

OpenFlashChartComponent

I’ve just checked in Nick Goodman’s OpenFlashChartComponent into the bi-platform code base.  I’ve worked with Nick and Tom over the past week, adding support for many of the standard pentaho chart types.  Here is a list of supported charts:

LineChart
BarChart - Horiztonal, Sketch, 3D, Glass, Stacked
BarLineChart
PieChart
DotChart
BubbleChart
AreaChart

You can grab the source, or wait until our next release is out, which should be real soon.  Here’s our standard bar chart example rendered in flash:

We used OFC4J, and DZ’s patched Open Flash Chart 2. We’re now working on adding documentation and examples. Enjoy!